Restaurant COGS Dashboard
Interactive web application for restaurant managers to track, analyze and optimize Cost of Goods Sold with intelligent alert system
Restaurant COGS Dashboard
An interactive web application designed for restaurant managers to track, analyze, and optimize Cost of Goods Sold (COGS). The application enables real-time monitoring of key profitability metrics, historical trend analysis, and most importantly, automatic alerts for concerning changes.
Overview
COGS Dashboard provides restaurant managers with intelligent insights into their cost structure. Thanks to the smart notification system and dedicated backend with persistent database storage, users are immediately informed about sudden price increases of key products, enabling quick reactions, supplier negotiations, or searching for alternative supply sources. All historical price data, alert configurations, and supplier settings are stored persistently in SQLite database.
Key Features
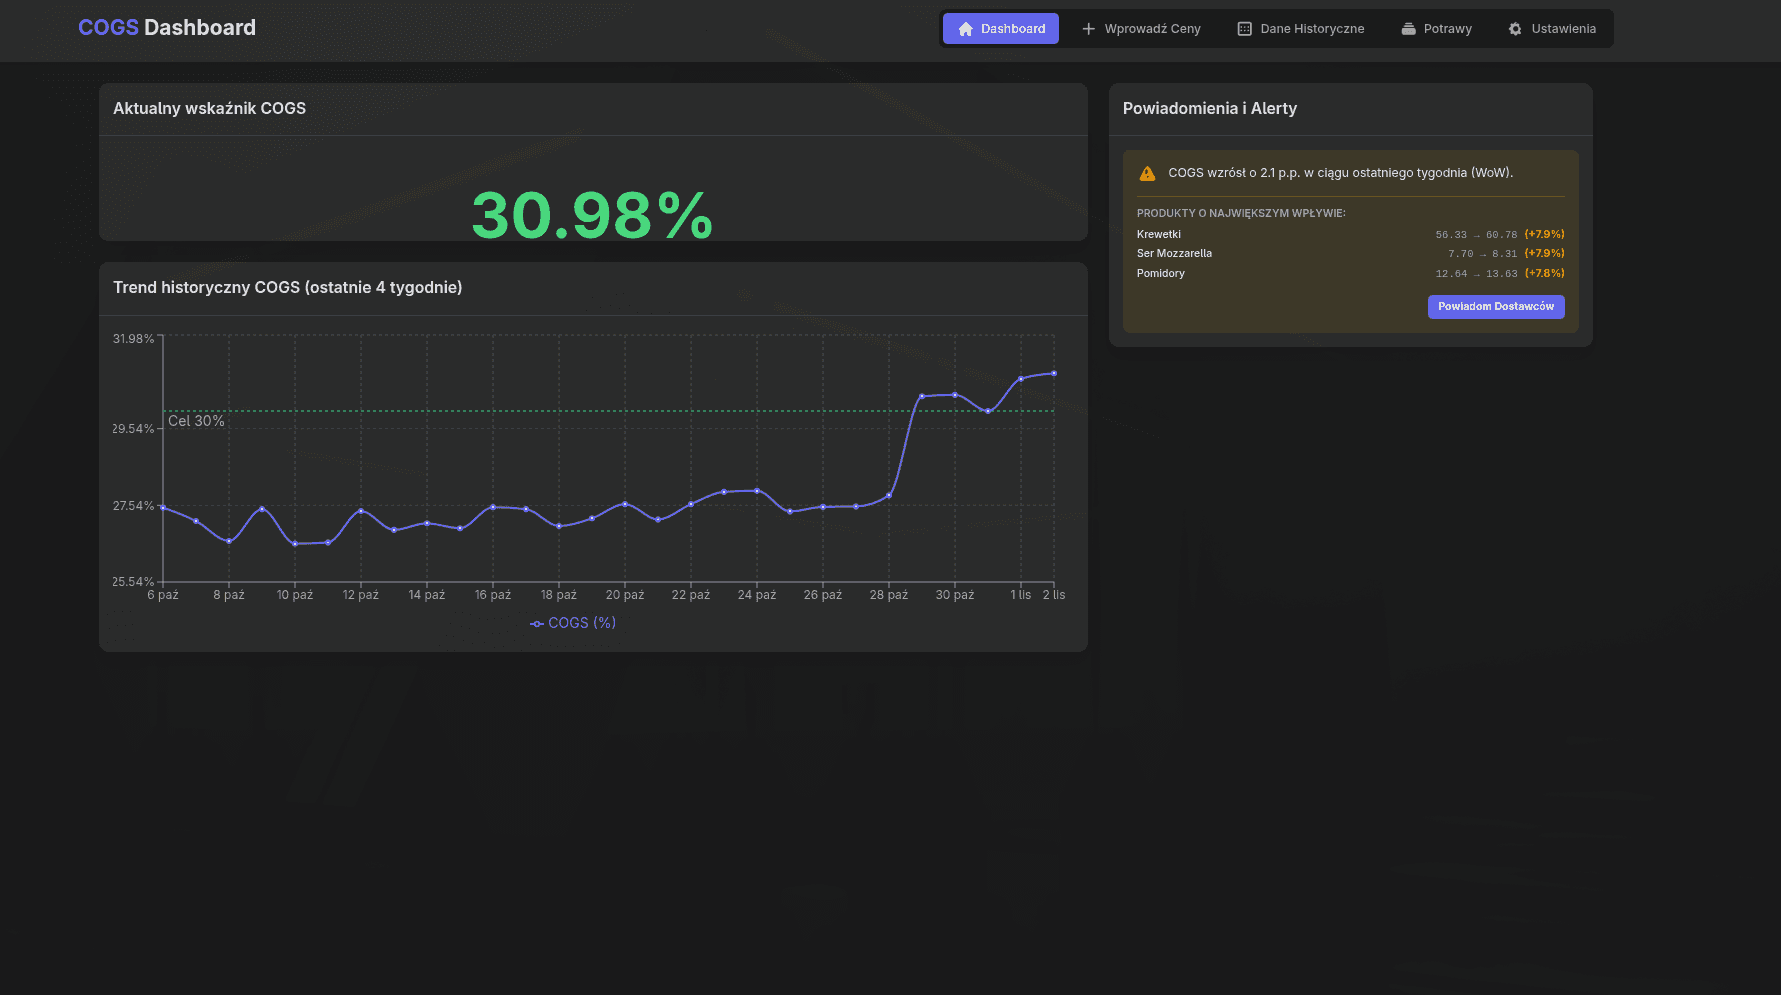
Real-Time Dashboard
Central view with current COGS indicator, historical trend chart, and alert panel
Price Entry
Simple form for daily input of current product purchase prices with persistent database storage
Historical Data
Table with archived price data for all products fetched from SQLite database
Intelligent Alerts
Automatic notifications about critical changes and negative trends
Screenshots
Main dashboard displaying
current COGS percentage, trend chart, and active alerts.
 Simple interface for daily
price updates with validation.
Simple interface for daily
price updates with validation.
 Comprehensive table with
archived pricing data and filtering options.
Comprehensive table with
archived pricing data and filtering options.
 Alert panel showing critical and
warning notifications with detailed analysis.
Alert panel showing critical and
warning notifications with detailed analysis.
Alert panel showing critical and
Dishes with the products and quantity.
How COGS Calculation Works
The COGS indicator in the application is calculated as an average value for all dishes defined in the system.
Calculation Logic
1. Dish Cost
For each dish, the system sums up the cost of its ingredients based on their quantity in the recipe and the current daily product price.
Dish Cost = Σ (ingredient_quantity × product_price)2. COGS for Dish
Then, for each dish, an individual COGS indicator is calculated.
Dish COGS % = (Dish Cost / Dish Sale Price) × 1003. Average Daily COGS
The value presented on the dashboard is the arithmetic average of COGS indicators for all dishes on a given day.
Average COGS = (Σ COGS % of All Dishes) / Number of DishesThis method provides a general picture of restaurant profitability on a given day.
Alert System
The alert system is the heart of the application and works based on COGS history analysis.
Critical Alert (Red)
Critical Threshold
Condition: Latest calculated daily COGS indicator exceeds 35%
Purpose: Signal a serious profitability problem requiring immediate intervention. The 35% threshold is considered critical for most food service establishments.
Warning Alert (Yellow) - Week-over-Week Growth
WoW Growth Detection
Condition: Average COGS from the last 7 days is more than 2 percentage points higher than the average COGS from the previous 7 days.
Purpose: Detect sudden and significant cost increases that may have been caused by supplier price hikes. This alert triggers additional in-depth analysis.
Warning Alert (Yellow) - Negative Trend
Trend Analysis
Condition: Average weekly COGS grows for at least two consecutive weeks (each increase must be at least 0.5 p.p.).
Purpose: Draw attention to a slower but steady and concerning upward cost trend that may become a problem in the long term.
Price Increase Analysis
When a WoW growth alert is triggered, the system automatically performs analysis to identify its main causes:
Analysis Process
-
Price Comparison
- System compares average product prices from the last week with average prices from the previous week
-
Impact Calculation
- To find products that actually had the most impact on cost increase, the system considers not only the percentage price change but also the frequency of product use in all recipes
Impact = (New Average Price - Old Average Price) × Sum of Quantities in Recipes- Results Presentation
- Alert on the dashboard is enriched with a list of 3 products with the highest impact, along with information about old price, new price, and percentage change
Supplier Email Automation
In response to a WoW growth alert, users can react immediately thanks to the "Notify Suppliers" button.
Configuration
In the "Settings" tab, users define (all settings are persistently stored in the database):
- Main supplier email address
- Up to 3 alternative supplier email addresses
- Message template requesting price increase explanation (variable
{productList}) - Quote request template (variable
{productList})
Message Generation
After clicking the button, the system uses the mailto: protocol to prepare two versions of email messages and opens the user's default email program:
To Main Supplier
- Message requesting explanation where
{productList}is replaced with a detailed list of products, their old and new prices, and percentage increase
To Alternative Suppliers
- Message with quote request where
{productList}is replaced with just the names of products whose prices increased
Users have full control over the final content and timing of message sending.
User Guide
Step 1: Configuration
Navigate to the Settings tab and fill in supplier email addresses and customize message templates to your needs. All settings are automatically saved to the database.
Step 2: Data Entry
Daily visit the Enter Prices tab to update product purchase prices. All price entries are stored in the SQLite database for historical tracking.
Step 3: Monitoring
Observe the Dashboard to track current COGS, its trend, and any alerts.
Step 4: Response
If a price increase alert appears, analyze the product list and use the Notify Suppliers button to quickly send appropriate inquiries.
Step 5: Analysis
Use the Historical Data and Dishes tabs to perform deeper analyses and better understand your restaurant's cost structure.
Technical Stack
The application is built with a full-stack architecture featuring persistent data storage and real-time price tracking.
React
Modern UI framework for building interactive interfaces
TypeScript
Type-safe development with enhanced IDE support
Tailwind CSS
Utility-first CSS framework for rapid styling
Recharts
Composable charting library for data visualization
Node.js + Express
Backend server for API endpoints and business logic
SQLite
Lightweight database for persistent data storage
Architecture
Frontend
- Framework: React 18+
- Language: TypeScript
- Styling: Tailwind CSS
- Charts: Recharts
- State Management: React Hooks
Backend
- Runtime: Node.js
- Framework: Express.js
- Database: SQLite
- Features:
- Stores historical product prices
- Simulates daily price data fetching
- Enables persistent storage of alert configurations and supplier email addresses
Features in Detail
Dashboard Module
- Real-time COGS percentage display
- Interactive historical trend chart
- Alert panel with color-coded notifications
- Quick access to all main functions
Price Entry Module
- Simple, intuitive form interface
- Product list with current prices
- Validation and error handling
- Bulk update capabilities
Historical Data Module
- Comprehensive data table
- Filtering and sorting options
- Export functionality
- Date range selection
Dishes Module
- Recipe management
- Ingredient list per dish
- Cost calculation per dish
- Sale price configuration
Settings Module
- Supplier contact management
- Email template customization
- Alert threshold configuration
- System preferences
Benefits
Cost Control
Monitor and control food costs in real-time
Quick Response
Immediate alerts enable fast supplier negotiations
Data-Driven
Make informed decisions based on historical trends
Time Saving
Automated analysis and email generation
Future Enhancements
- Backend integration with real database (SQLite)
- Persistent storage of historical prices
- Persistent storage of alert configurations
- Multi-restaurant support
- Mobile application
- Advanced forecasting with ML
- Integration with POS systems
- Automated supplier price comparison
- Recipe optimization suggestions
- Multi-currency support
- Migration to PostgreSQL/MySQL for production
License
Demonstration project - Educational purposes
Built with ❤️ for restaurant managers who want to optimize their operations
BlueCLIent - Bluesky TUI
A comprehensive Bluesky client with a modern TUI (Terminal User Interface) built using Textual framework. Features post scheduling, feed management, and real-time firehose access.
Fleet Driver Assistant - IN WORKS!
Comprehensive Android app for fleet drivers, fleet managers with ride analytics and safety features for both drivers and passangers